Quantitative Imaging
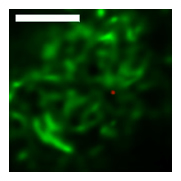
Super-Resolution Imaging

Left to Right: Actin in RBL-2H3 cells, Microtubules in a 3T3 cell, EGFR on the membrane of a CHO cell. All scale bars are 1 micron.
Super-Resolution Technology Core
The mission of the Super-Resolution and Hyperspectral Microscopy Core (SR-core) is to develop and apply imaging technologies that can be used to study the organization and dynamics of cellular components at the 10 nm scale. Currently, the SR-core is focused around 3 technologies: Single-Molecule-Localization based Super-Resolution imaging (SML-SR), high-speed HyperSpectral Microscopy (HSM) and Single Particle Tracking (SPT). SML-SR (a.k.a PALM, fPALM, STORM, GSDIM) relies on the localization of individual fluorescent probes, uses photo-switchable or photo-activatable dyes or fluorescent proteins, and can provide spatial resolution in the range of 10 to 50 nm. Our high speed HSM can be used for, among other many other things, tracking high densities of membrane proteins using up to eight colors of quantum dot labeled ligands. SPT is a general purpose tool that can be used for monitoring protein mobility in the plasma membrane of living cells and can be performed with our high-speed HSM or our general purpose TIRF/SR microscope.

High-speed Laser Line Scanning Hyperspectral Microscope
The SR-core HyperSpectral Microscope (HSM) was designed specifically for the application of multi-color quantum dot tracking and can be used for 2D tracking of up to eight colors of quantum dots. The HSM can operate at a frame rate up to 30 frames/sec with an imaging area of approximately 30 μm2 while each spatial pixel collects 128 spectral channels. Our system is designed to span the spectral range from 500 to 750 nm. A single 488 nm laser wavelength (which is used to simultaneously excite all spectral species of QDs) is manipulated with a laser line generating lens and other optics to provide a uniform (vertical) and diffraction limited (horizontal) line at the microscope focal plane. The laser line is scanned across the sample using a galvonometer controlled mirror. Emission light is de-scanned and passes through a prism spectrometer and is imaged with a high-speed, EMCCD camera.

Single Molecule TIRF/SR Microscope
The SR-core TIRF/SR microscope consists of an objective based TIRF system with 405, 488, 532, 561, and 635 nm lasers. The system includes a 4-color emission beam splitter and a back-illuminated EMCCD camera. This setup can be used for SPT, SML-SR, or other general purpose wide-field imaging experiments. A separate optical pathway allows for 3D SR imaging using a dual focal plane setup.
Additional expertise in SR imaging is available though collaboration with STMC member J. Timlin at SNL, who has developed both hyperspectral fluorescence line scanning and hyperspectral confocal fluorescence microscopy systems.
Fluorescence-based Technologies to Quantify Diffusion, Protein-Protein Interactions
Wide-field and Confocal Imaging
Intensive effort has been invested in the use of multi-color quantum dot probes and wide-field fluorescence imaging to quantify the movements of cell surface receptors, as well as capturing such processes as receptor dimerization and internalization in real time. The image at left, taken from Andrews et al., Nature Cell Biology 2007, demonstrates the use of monovalent IgE-quantum dot probes to visualize the trapping of an individual IgE receptor within a dynamically-rearranging network of actin "corrals." The repertoire of "conventional" fluorescence microscopy methods in wide field and confocal modes at UNM also includes TIRF (Total Internal Reflection), FRAP (fluorescence recovery after photobleaching) and FRET (Förster resonance energy transfer). 3D confocal microscopy is available through collaboration with STMC member at LANL, Jim Werner. Dual color TIRF is available through collaboration with STMC member at SNL, Jerilyn Timlin.
Electron Microscopy

Electron Microscopy
An important STMC technology is the 2D imaging of membrane sheets ("rip-flips") to study the distribution of receptors and their signaling partners on the plasma membrane. The method is based upon isolation of membranes on grids, before or after timed exposure to ligands, followed by fixation and immunogold labeling. After processing, grids are imaged by transmission electron microscopy (TEM) and gold particle distributions are analyzed using rigorous spatial statistics methods (see Particle Picking, gold code and Clustering Quantification on our Tools and Data page). The image at left shows the spatial proximity of IgE receptors (FcεRI) and the Formyl Peptide Receptor (FPR) when ligands for both receptors were added simultaneously (Xue et al., Molecular Biology of the Cell 2007). This work provided the first evidence for localized crosstalk between tyrosine kinase-coupled receptors and GPCRs. STMC investigators continue to use this technology to examine and quantify the spatial relationships of receptors, including ITAM-bearing immunoreceptors and the EGFR/Erb and Met families of growth factor receptors.
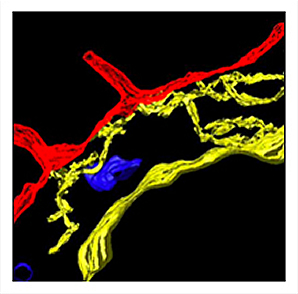
Reconstruction of 3-D cell structure
Reconstruction of 3-D cell structure is also an emphasis of the electron microscopists, with the specific goal of providing mathematical modeling partners with accurate geometry for simulating signaling in a cellular context. The image at left shows the spatial relationships of the endoplasmic reticulum (yellow), mitochondria (blue) and plasma membrane (red) in RBL-2H3 cells. It was reconstructed from an electron tomographic tilt series (performed at the National Center for Microscopy and Imaging Research, UCSD).
3-D Topography of the Inside of the Plasma membrane
The movie above is a 3-D tomogram of an ARF-6 positive structure, involved in endocytosis in mast cells. See new article by Cleyrat et al, Journal of Cell Science 2013.
Watch movie at full size on Vimeo
