Tools and Data
If you use any of STMC's tools and/or data in a publication, we would be grateful if you would acknowledge them with a statement similar to the following:
We acknowledge the University of New Mexico's SpatioTemporal Modeling Center for providing _the specified tools and/or data_ via their website (http://stmc.unm.edu/).
IMAGE ANALYSIS TOOLS
MATLAB Clustering Classes
Updated version of the H-SET collection to include pair correlation and 3D.
Download MATLAB Clustering Classes Version 3 (.zip) [December 19, 2018]
Download MATLAB Clustering Classes Version 2 (.zip) [December 5, 2016]
Download MATLAB Clustering Classes Version 1 (.zip) [June 14, 2016]
H-SET
Clustering, SimulateDomains, SRcluster are a set of MATLAB classes that
- collect together various spatial clustering statistics and algorithms (hierarchal, DBSCAN [4 versions], Getis based, Voronoi based);
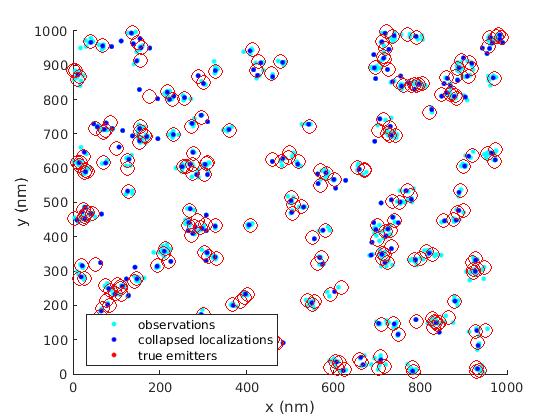
- simulations of spatial domains (clusters) of fluorophore localizations that exhibit distributions of observations representing blinks; and
- a top-down clustering algorithm to collapse clusters of observations of blinking fluorophores into a single estimate of the true location of the fluorophore using a log-likelihood hypothesis test (H-SET: Hierarchical Single Emitter Hypothesis Test).
The methodologies are described in more detail in the internal documentation and in:
Jia Lin, Michael J. Wester, Matthew S. Graus, Keith A. Lidke and Aaron K. Neumann. Nanoscopic cell wall architecture of an immunogenic ligand in Candida albicans during antifungal drug treatment. Molecular Biology of the Cell, Volume 27, Number 6, March 15, 2016, 1002-1014 (DOI: 10.1091/mbc.E15-06-0355, PMID: 26792838).
Download H-SET (.zip)
SkullStrip
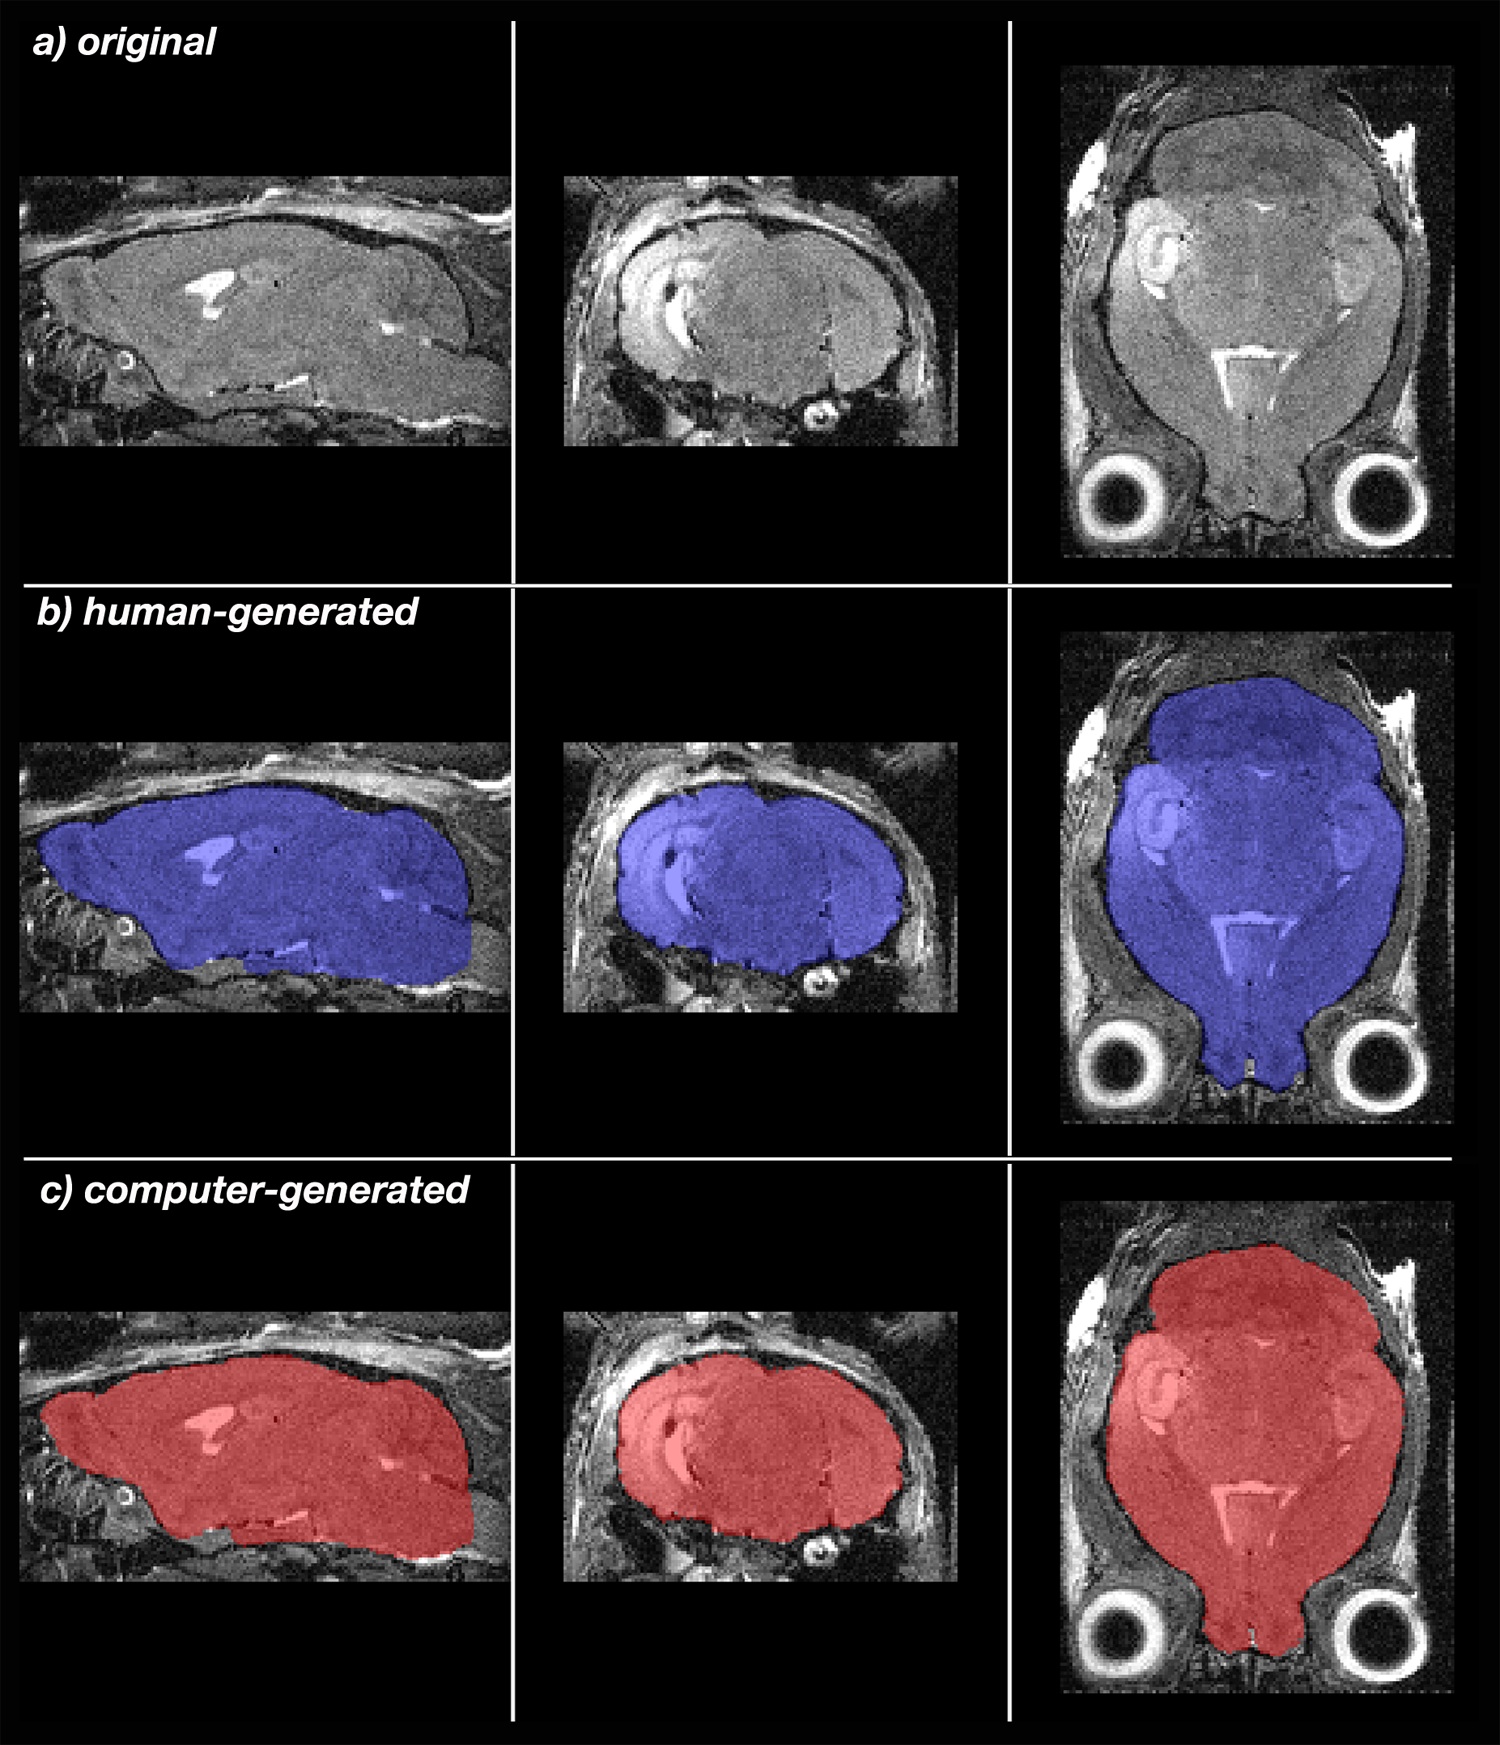
Skullstrip is a tool for semi-automated skull stripping of mouse whole head images to extract the brain from non-brain tissue. This automation increases the speed of brain extraction from hours to minutes, and produces more consistent masks improving alignments of many brains for statistical analysis. The download includes Instructions, README and the program, which runs in Python on either Mac, Windows or Linux machines. README contains complete directions to load the program, and Instructions guide applications. The program is described in detail in A simple rapid process for semi-automated brain extraction from magnetic resonance images of the whole mouse head.
Delora A, Gonzales A, Medina CS, Mitchell A, Mohed AF, Jacobs RE, Bearer EL. J Neurosci Methods. 2015 Oct 9. pii: S0165-0270(15)00370-2. doi: 10.1016/j.jneumeth.2015.09.031. [Epub ahead of print] PMID: 26455644.
Please cite this reference when using the program.
Download SkullStrip (.zip)
ContactAnalysis
Last update: April 2014
ContactAnalysis is a tool for the analysis of host-pathogen contacts, fully described in Matthew S. Graus, Carolyn Pehlke, Michael J. Wester, Lisa B. Davidson,
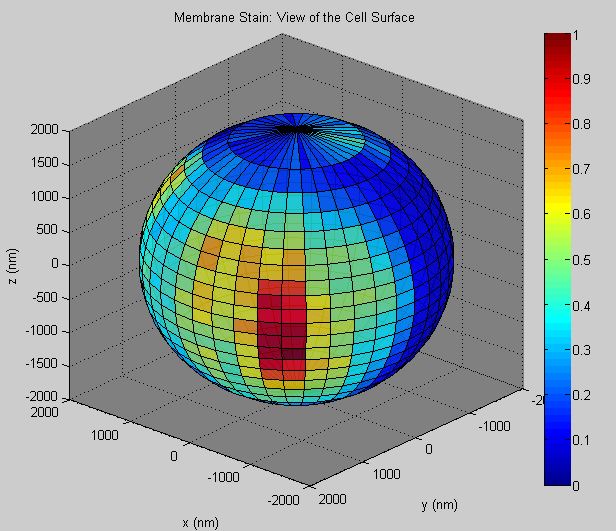
Stanly L. Steinberg and Aaron K. Neumann, "A New Tool to Quantify Receptor Recruitment to Cell Contact Sites during Host-Pathogen Interaction", PLoS Computational Biology, Volume 10, Number 5, May 2014, 1--17 (DOI: 10.1371/journal.pcbi.1003639, PMID: 24874253, PMCID: PMC4038466). It includes a user interface that allows the scientist to both visualize and quantify receptor distribution in and recruitment to spherical cell-cell contact sites. This software requires the DipImage toolbox for Matlab. Please see the operating instructions![]() for more information.
for more information.
Download ContactAnalysis (.zip)
SuperCluster
Last update: April 2014
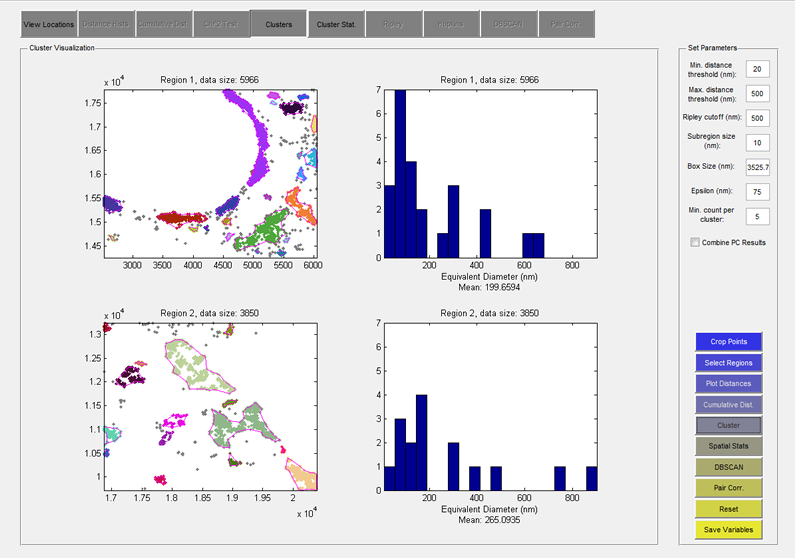
SuperCluster is a set of tools for super-resolution data analysis. It consists of a graphical user interface (GUI) from which a user can select a number of regions of interest in their super-resolution data set, or dynamically simulate super-resolution data, and launch multiple analysis routines including: pairwise distance distribution, cumulative density function, clustering analysis (based on the Getis G statistic), spatial statistics (Hopkins and Ripley), DBSCAN clustering analysis, and pair auto-correlation (from Veatch, et al. 2012). Please see the operating instructions![]() for more information.
for more information.
Download the SuperCluster program code (matlab .m file)
Required MATLAB toolboxes and classes: Image Processing Toolbox, Statistics Toolbox, DERIVEST Suite (used in autocorrelation curve fitting)
Particle picking
Download the ImageJ setup file (for Microsoft Windows; files for other operating systems or new versions can be found at the ImageJ website). Execute this file to install to ImageJ.
Next, download the ParticlePicker plugin and the CoLocalization plugin. Copy these two files to the plugins directory of ImageJ (preferably, create separate folders under plugins to hold each file). Start ImageJ. Click "Plugins Compile and Run Plugin" to compile these two programs. (Note: since there is no image present, the Run part will produce errors which can safely be ignored.) Restarting ImageJ, you should see "ParticlePicker" and "Colocalization" in the Plugins menu. Further instructions on installation and usage of these plugins can be found in (ParticlePicker) [txt] AND [doc][pdf] and (Colocalization) [doc][pdf], respectively.
gold code
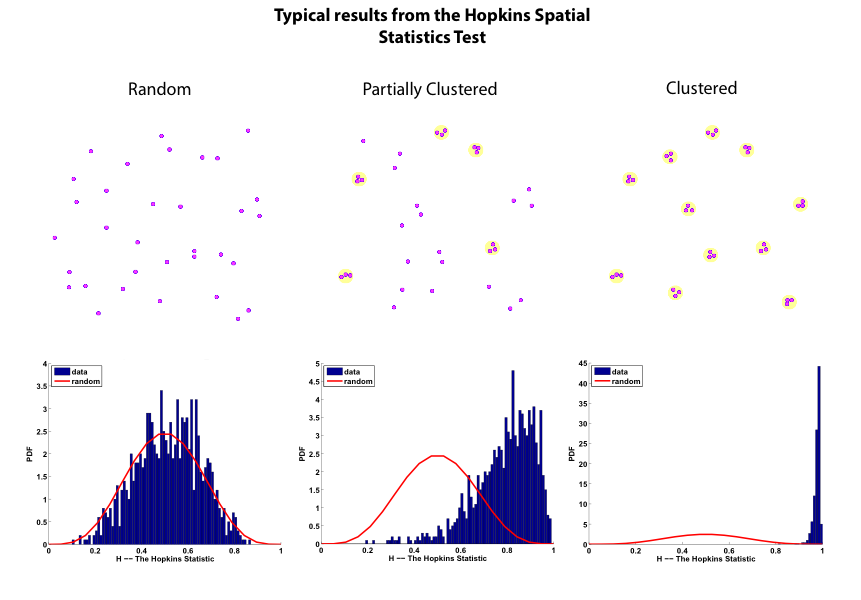
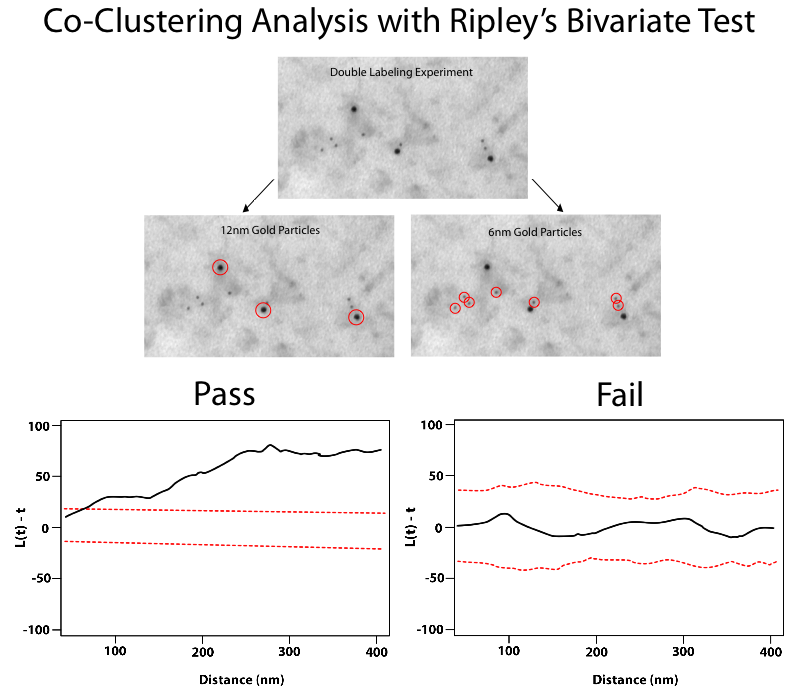
gold code is a MATLAB package for computing Hopkins and Ripley (including bivariate Ripley) statistics for positions of one or two sizes of particles in a cell membrane. The data is assumed to be listed as text in a simple i, x(i), y(i) format. The package can also detect particle clusters and hierarchical relationships among them by performing a dendrogram analysis. This latter capability (the dendrogram analysis) requires the MATLAB Statistics Toolbox to be installed. The default interaction is through a GUI, although analyses can also be performed via a command line interface. More details can be found in the README.
Clustering Quantification
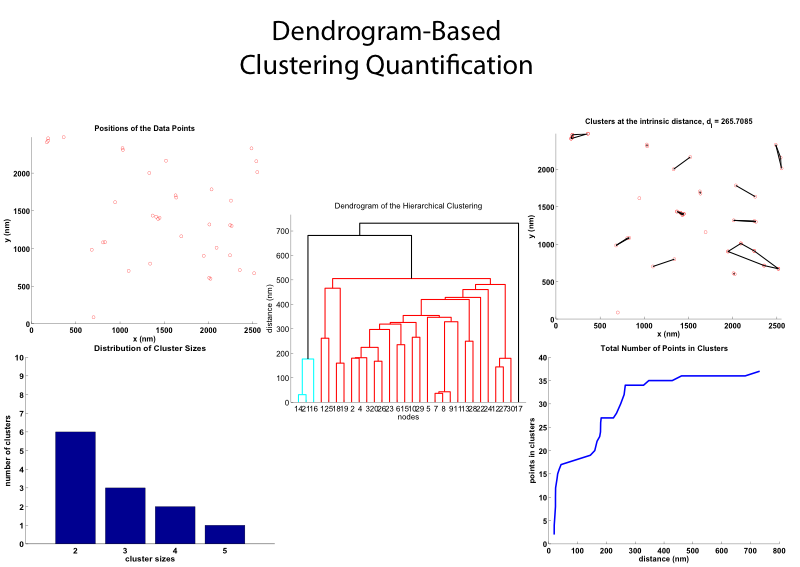
The Clustering Quantification Program uses the MATLAB function "dendrogram" to to compute and display a hierarchy of clusters that depends on a clustering distance d. Input is a set of coordinates in the plane, X = [x_i, y_i], where i = 1:M and by default, the data points have units of 'nm' (which can be changed). The CQ Program produces the first distance that identifies the maximum number of clusters, which is termed the intrinsic clustering distance d_I. At this distance, clustering information is recorded and some plots of this information are displayed. To be able to visualize the identified clusters, the MATLAB function "convexHull" is used to outline the clusters.
Flor A. Espinoza, Janet M. Oliver, Bridget S. Wilson and Stanly L. Steinberg, "Using Hierarchical Clustering and Dendrograms to Quantify the Clustering of Membrane Proteins", Bulletin of Mathematical Biology, Volume 74, Number 1, January 2012, 190--211 (DOI: 10.1007/s11538-011-9671-3).
Viewing MATLAB movies of particles
Download DIPimage, a MATLAB toolbox for scientific image processing and analysis. Next, create an initialization file like dip.m, which specifies where DIPimage is installed. If MATLAB is started in the directory where this file residues, typing "dip" will initialize DIPimage. Load an image file: "load('080220-1a')". If the image is contained in the variable "sequence", "dipshow(sequence)" will display it, however, it is usually necessary to first execute Mappings -› Linear stretch to make the image visible. "dipimage" will bring up a variety of windows for further analyses.
Modeling Tools
STMC modelers are developing mathematical models of complex biological systems that play a role in cellular signaling. These models are being used to learn about specific systems, particularly signal transduction systems important in the immune system and cancer.
The LANL Modeling team has developed an OmniGraffle template for drawing extended contact maps. The template is freely available online: http://bionetgen.org/index.php/Extended_Contact_Maps.
The LANL Modeling team, in collaboration with the Dinner group at U of Chicago, has made source code for predicting transcription factor binding sites using physicochemical features of DNA. The code is freely available online: http://dinner-group.uchicago.edu/downloads.html.
Data
Letendre, K., Asperti-Boursin, F., Donnadieu, E., Moses, M.E, and Cannon, J.L. (2015) Bringing Statistics Up To Speed With Data in Analysis of Lymphocyte Motility. Download data here.
Youssef LA, Schuyler M, Gilmartin L, Pickett G, Bard JDJ, Tarleton CA, Archibeque T, Qualls C, Wilson BS and Oliver JM. (2007) Histamine Release from the Basophils of Control and Asthmatic Subjects and a Comparison of Gene Expression between "Releaser" and "Nonreleaser" Basophils. J Immunol 2007;178: 4584-4594" Download The Affymetrix Microarray Data here (.zip).
Links to Other Resources
StochSS: Stochastic Simulation Service
A Cloud Computing Framework for Modeling and Simulation of Stochastic Biochemical Systems
